
I’ll resolve to use the word “skeptic” in place of “denialist" in 2016. David can continue to use the word “alarmist" since a true alarm is more than appropriate.
Cartoons do little to advance understanding and mainly tries to enflame.
But I’ll post more about this cartoon (and the 2015 DATA) this afternoon. I see where this feud apparently entertains many here at BL.
AGW/Climate Change Debate 2016
Moderator: Jon Estes
50 posts
• Page 1 of 2 • 1, 2
Re: AGW/Climate Change Debate 2016
![]() by KeithE » Sun Jan 03, 2016 9:17 am
by KeithE » Sun Jan 03, 2016 9:17 am
Informed by Data.
Driven by the SPIRIT and JESUS’s Example.
Promoting the Kingdom of GOD on Earth.
Driven by the SPIRIT and JESUS’s Example.
Promoting the Kingdom of GOD on Earth.
-

KeithE - Site Admin
- Posts: 9362
- Joined: Thu Aug 12, 2004 8:02 pm
- Location: Huntsville, AL
Re: AGW/Climate Change Debate 2016
![]() by KeithE » Sun Jan 03, 2016 11:27 pm
by KeithE » Sun Jan 03, 2016 11:27 pm
Informed by Data.
Driven by the SPIRIT and JESUS’s Example.
Promoting the Kingdom of GOD on Earth.
Driven by the SPIRIT and JESUS’s Example.
Promoting the Kingdom of GOD on Earth.
-
KeithE - Site Admin
- Posts: 9362
- Joined: Thu Aug 12, 2004 8:02 pm
- Location: Huntsville, AL
Re: AGW/Climate Change Debate 2016
![]() by KeithE » Wed Jan 06, 2016 10:52 am
by KeithE » Wed Jan 06, 2016 10:52 am
Informed by Data.
Driven by the SPIRIT and JESUS’s Example.
Promoting the Kingdom of GOD on Earth.
Driven by the SPIRIT and JESUS’s Example.
Promoting the Kingdom of GOD on Earth.
-
KeithE - Site Admin
- Posts: 9362
- Joined: Thu Aug 12, 2004 8:02 pm
- Location: Huntsville, AL
Re: AGW/Climate Change Debate 2016
![]() by KeithE » Sun Jan 10, 2016 9:28 am
by KeithE » Sun Jan 10, 2016 9:28 am
Informed by Data.
Driven by the SPIRIT and JESUS’s Example.
Promoting the Kingdom of GOD on Earth.
Driven by the SPIRIT and JESUS’s Example.
Promoting the Kingdom of GOD on Earth.
-
KeithE - Site Admin
- Posts: 9362
- Joined: Thu Aug 12, 2004 8:02 pm
- Location: Huntsville, AL
Re: AGW/Climate Change Debate 2016
![]() by KeithE » Sun Jan 10, 2016 3:17 pm
by KeithE » Sun Jan 10, 2016 3:17 pm
Informed by Data.
Driven by the SPIRIT and JESUS’s Example.
Promoting the Kingdom of GOD on Earth.
Driven by the SPIRIT and JESUS’s Example.
Promoting the Kingdom of GOD on Earth.
-
KeithE - Site Admin
- Posts: 9362
- Joined: Thu Aug 12, 2004 8:02 pm
- Location: Huntsville, AL
Hottest Year Ever
![]() by KeithE » Wed Jan 20, 2016 8:01 pm
by KeithE » Wed Jan 20, 2016 8:01 pm
Informed by Data.
Driven by the SPIRIT and JESUS’s Example.
Promoting the Kingdom of GOD on Earth.
Driven by the SPIRIT and JESUS’s Example.
Promoting the Kingdom of GOD on Earth.
-
KeithE - Site Admin
- Posts: 9362
- Joined: Thu Aug 12, 2004 8:02 pm
- Location: Huntsville, AL
Re: AGW/Climate Change Debate 2016
![]() by KeithE » Fri Jan 22, 2016 10:15 pm
by KeithE » Fri Jan 22, 2016 10:15 pm
Informed by Data.
Driven by the SPIRIT and JESUS’s Example.
Promoting the Kingdom of GOD on Earth.
Driven by the SPIRIT and JESUS’s Example.
Promoting the Kingdom of GOD on Earth.
-
KeithE - Site Admin
- Posts: 9362
- Joined: Thu Aug 12, 2004 8:02 pm
- Location: Huntsville, AL
Re: AGW/Climate Change Debate 2016
![]() by KeithE » Fri Jan 22, 2016 10:22 pm
by KeithE » Fri Jan 22, 2016 10:22 pm
David,
I mistakenly deleted your post that started with “In a land far away” . Then it had the quote I attributed to you in the post above.
Then it had the 4 “skeptical” articles. I have lost those and if you can please add them again (not that I will agree with them).
That’s the trouble with being the moderator - I can inadvertently delete stuff by hitting the “edit” button when I meant to hit the “quote” button.
Informed by Data.
Driven by the SPIRIT and JESUS’s Example.
Promoting the Kingdom of GOD on Earth.
Driven by the SPIRIT and JESUS’s Example.
Promoting the Kingdom of GOD on Earth.
-
KeithE - Site Admin
- Posts: 9362
- Joined: Thu Aug 12, 2004 8:02 pm
- Location: Huntsville, AL
Re: AGW/Climate Change Debate 2016
![]() by Haruo » Sun Jan 24, 2016 5:31 pm
by Haruo » Sun Jan 24, 2016 5:31 pm
Haruo = Leland Bryant Ross
—
—
—
—
-

Haruo - Site Admin
- Posts: 13131
- Joined: Sat Aug 14, 2004 7:21 pm
- Location: Seattle
Re: AGW/Climate Change Debate 2016
![]() by Dave Roberts » Fri Nov 11, 2016 9:19 am
by Dave Roberts » Fri Nov 11, 2016 9:19 am
Funny that the US Navy is spending great amounts of money at the Norfolk Naval Station to deal with the rising levels of the Chesapeake Bay. Guess that is an inconvenient truth. Wonder if Trump will stop that expenditure to protect naval assets in a very vulnerable area which has seen coastal flooding twice this year.
"God will never be less than He is and does not need to be more" (John Koessler)
My blog: http://emporiadave.wordpress.com/
My blog: http://emporiadave.wordpress.com/
-

Dave Roberts - Site Admin
- Posts: 7714
- Joined: Thu Aug 12, 2004 1:01 pm
- Location: Southside, VA
Re: AGW/Climate Change Debate 2016
![]() by KeithE » Sat Nov 12, 2016 12:56 pm
by KeithE » Sat Nov 12, 2016 12:56 pm
Informed by Data.
Driven by the SPIRIT and JESUS’s Example.
Promoting the Kingdom of GOD on Earth.
Driven by the SPIRIT and JESUS’s Example.
Promoting the Kingdom of GOD on Earth.
-
KeithE - Site Admin
- Posts: 9362
- Joined: Thu Aug 12, 2004 8:02 pm
- Location: Huntsville, AL
Re: AGW/Climate Change Debate 2016
![]() by William Thornton » Sat Nov 12, 2016 3:22 pm
by William Thornton » Sat Nov 12, 2016 3:22 pm
Yeah. Then there's the DNC guy who said trumps election cut his lifespan by 40 years.
My stray thoughts on SBC stuff may be found at my blog,
-

William Thornton - Site Admin
- Posts: 12613
- Joined: Thu Aug 12, 2004 9:30 pm
- Location: Atlanta
Re: AGW/Climate Change Debate 2016
![]() by Joseph Patrick » Sat Nov 12, 2016 3:53 pm
by Joseph Patrick » Sat Nov 12, 2016 3:53 pm
From Joseph Patrick...aka Gerry Milligan
For David and Sen. Inhoff (of Oklahoma, where else?), I offer Biblical proof of Global Warming...If, and only if one considers the Bible inerrant. To wit: Paul talks about landing on a sandy beach on the island of Malta. As one who has sailed completely around Malta, I can assure all of you that there is no sandy beach, anywhere. All there is on all coasts are rocks, about 3 to 5 feet above sea level. Only global warming could have melted the polar icecaps to such a degree that there are no longer sandy beaches.
For David and Sen. Inhoff (of Oklahoma, where else?), I offer Biblical proof of Global Warming...If, and only if one considers the Bible inerrant. To wit: Paul talks about landing on a sandy beach on the island of Malta. As one who has sailed completely around Malta, I can assure all of you that there is no sandy beach, anywhere. All there is on all coasts are rocks, about 3 to 5 feet above sea level. Only global warming could have melted the polar icecaps to such a degree that there are no longer sandy beaches.
- Joseph Patrick
- Posts: 689
- Joined: Sat Sep 25, 2004 12:53 am
- Location: Portland, OR
Re: AGW/Climate Change Debate 2016
![]() by KeithE » Sun Nov 13, 2016 8:23 am
by KeithE » Sun Nov 13, 2016 8:23 am
Besides your longstanding bluster, lack of scientific understanding, and denialist articles your cited above, you really should have noted that the second chart was global surface temperature (air temp at the surface) not sea level.
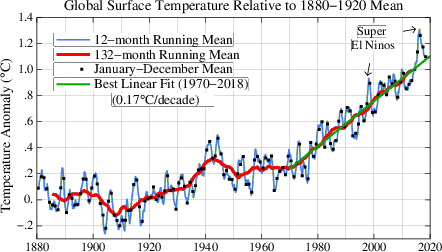
In this case it is temperature anomalies (that is deviation from some base period average) with the base period being 1880-1920. I rather like that base period rather than the often cited 1951-1980 which was far from constant. The 1880-1920 base period is fairly constant and more closely represents a time before industrial effluents started affecting temperature by increasing the amount of earth’s re-radiation particularly in the large CO2 absorption band of 12-20 microns.
BTW, that chart above ends your already untrue truncated satellite data temp ‘no temp rise in last eighteen years’ cherry picked story. Look again at very rapid rise since 2011. Truth is we have been on a rapid rise since 1972 - look at red line (6x as rapid as any temperature rate of increase associated with transitions out of ice ages).
Informed by Data.
Driven by the SPIRIT and JESUS’s Example.
Promoting the Kingdom of GOD on Earth.
Driven by the SPIRIT and JESUS’s Example.
Promoting the Kingdom of GOD on Earth.
-
KeithE - Site Admin
- Posts: 9362
- Joined: Thu Aug 12, 2004 8:02 pm
- Location: Huntsville, AL
50 posts
• Page 1 of 2 • 1, 2
Return to Politics and Public Policy Issues
Who is online
Users browsing this forum: No registered users and 111 guests