Meanwhile, here is the DATA (red line is projection - one that I do not buy into for certain; but the blue line is actual past paleoclimatic DATA measurements)

As for the Arctic Region which has seen the greatest global warming over the last 2000 years:

The blue line is paleoclimatic DATA from lake sediments, ice cores and tree rings proxies in this case. The red line is temperature measurements. Notice the overlap of agreement from Paleo data to temperature measurements in the 1900’s. Notice also the man-caused (imo and the opinion of 97% of global warming scientists) warming has overcome the natural downward trend.
Now you can believe that the recent “pause" in air temp will continue ad infinitum if you want (direct measurements are near constant over the last 11 years). But note that will be a bad enough with temperatures higher than the last peak ~5000 years ago and no one can rationally believe the ocean temps will stay constant.
.
And on Baffin Island has shown the temperature there are higher than any period for at 44,000 years. Watch the video taken on Baffin Island.
David reacts to every cold spell with political malevolence.
As for Roy Spencer’s measurements, here is his DATA which shows a 0.132C/decade increase in lower atmospheric temperatures from satellite microwave measurements (i=demagnify your screen to read it all if necessary - Apple+- on an Mac, CTRL+- on PC).
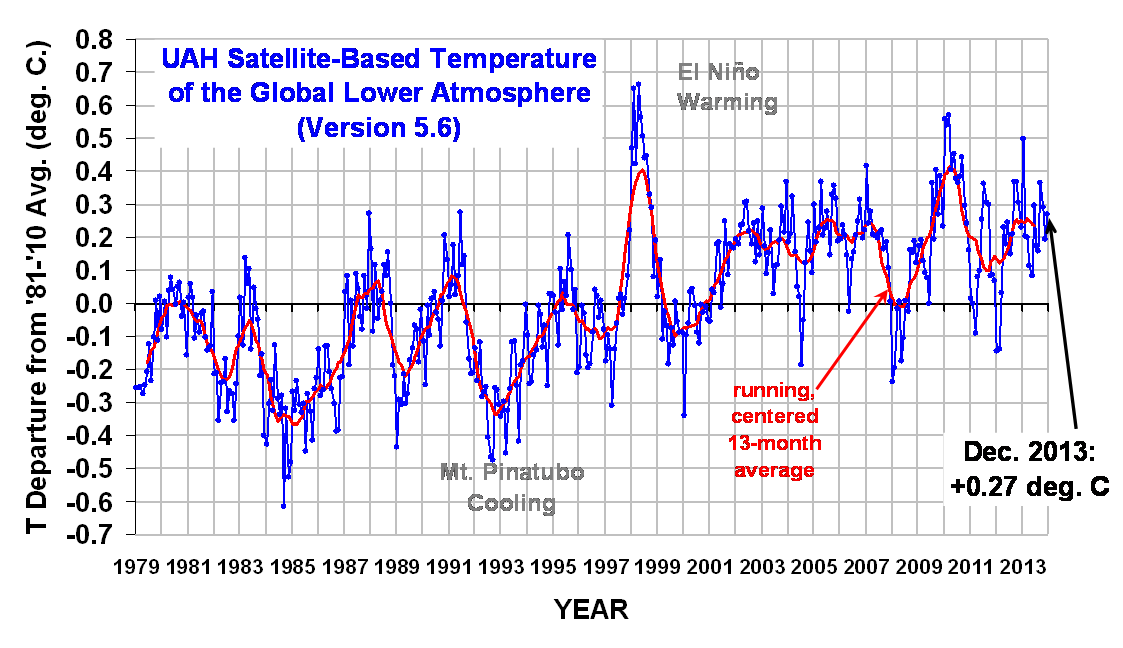
which is actually a somewhat greater rate than the surface temperature measurements as analyzed by and over the same period (1979-2013). I have no problem with his DATA. I also have no problem with his stance on Intelligent Design.
As for Roy Spencer’s GW/CC analysis and public proclamations, here is and a flavor for his politics in .
Consider these plots before you puke on them!
Informed by Data.
Driven by the SPIRIT and JESUS’s Example.
Promoting the Kingdom of GOD on Earth.


