Just for the truth of the matter,
globally this winter (Nov13-Jan14) has been approximately 0.1C warmer than the same months last winter (Nov12-Jan13). Actually it is 0.0966C hotter.
Read at the bottom of this .
Nov 12 had a 0.70C anomaly while Nov 13 had a 0.78C anomaly = 0.08C delta
Dec 12 had a 0.48C anomaly while Dec 13 had a 0.60C anomaly = 0.14C delta
Jan 13 had a 0.63C anomaly while Jan 14 had a 0.70C anomaly = 0.07C delta
average delta =0.0966C.
We will see what Feb brings in a week or two.
Now that was an uncommonly high delta between years. But if that were to continue that would be (rounded) 1C/decade = 10C/century = 18Fahrenheit/century. It won’t be that high by any computer model I know of, because real scientists look at the long term trends which are at about 1.4C/century (not 10C/century) with an eye on our continued emissions of ghgs and possible feedbacks (both positive and negative).
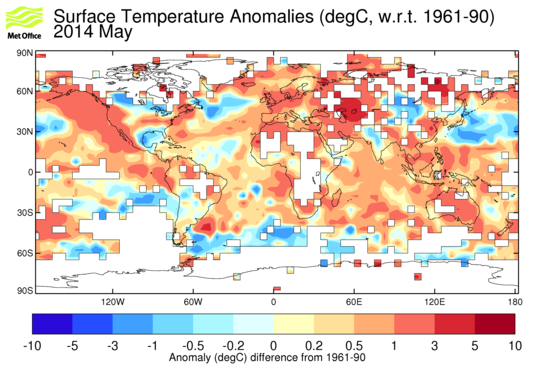
Graphically we can see the Jan 14 coldness in the Eastern US but not so over most of the earth.
David's cartoons about selected areas' coldness this winter, when globally the temps have seen an uncommonly high delta this winter from last year’s winter, shows his extreme bias in presentation of the facts.
Informed by Data.
Driven by the SPIRIT and JESUS’s Example.
Promoting the Kingdom of GOD on Earth.


